What is a Value Stream Map?
#Understanding Value Stream Maps
A Value Stream Map (VSM) is a powerful tool that helps you visualize, understand, and optimize you manufacturing system. By creating a map of your value stream, you can visualize how materials and information flow through your operation, from raw materials to finished goods delivered to the customer.
Think of a Value Stream Map as an X-ray of your manufacturing system—it reveals the inner workings of your operation, highlighting both value-adding activities and waste. This visibility is the first step toward improving your system’s performance and profitability.
#Key Components of a Value Stream Map
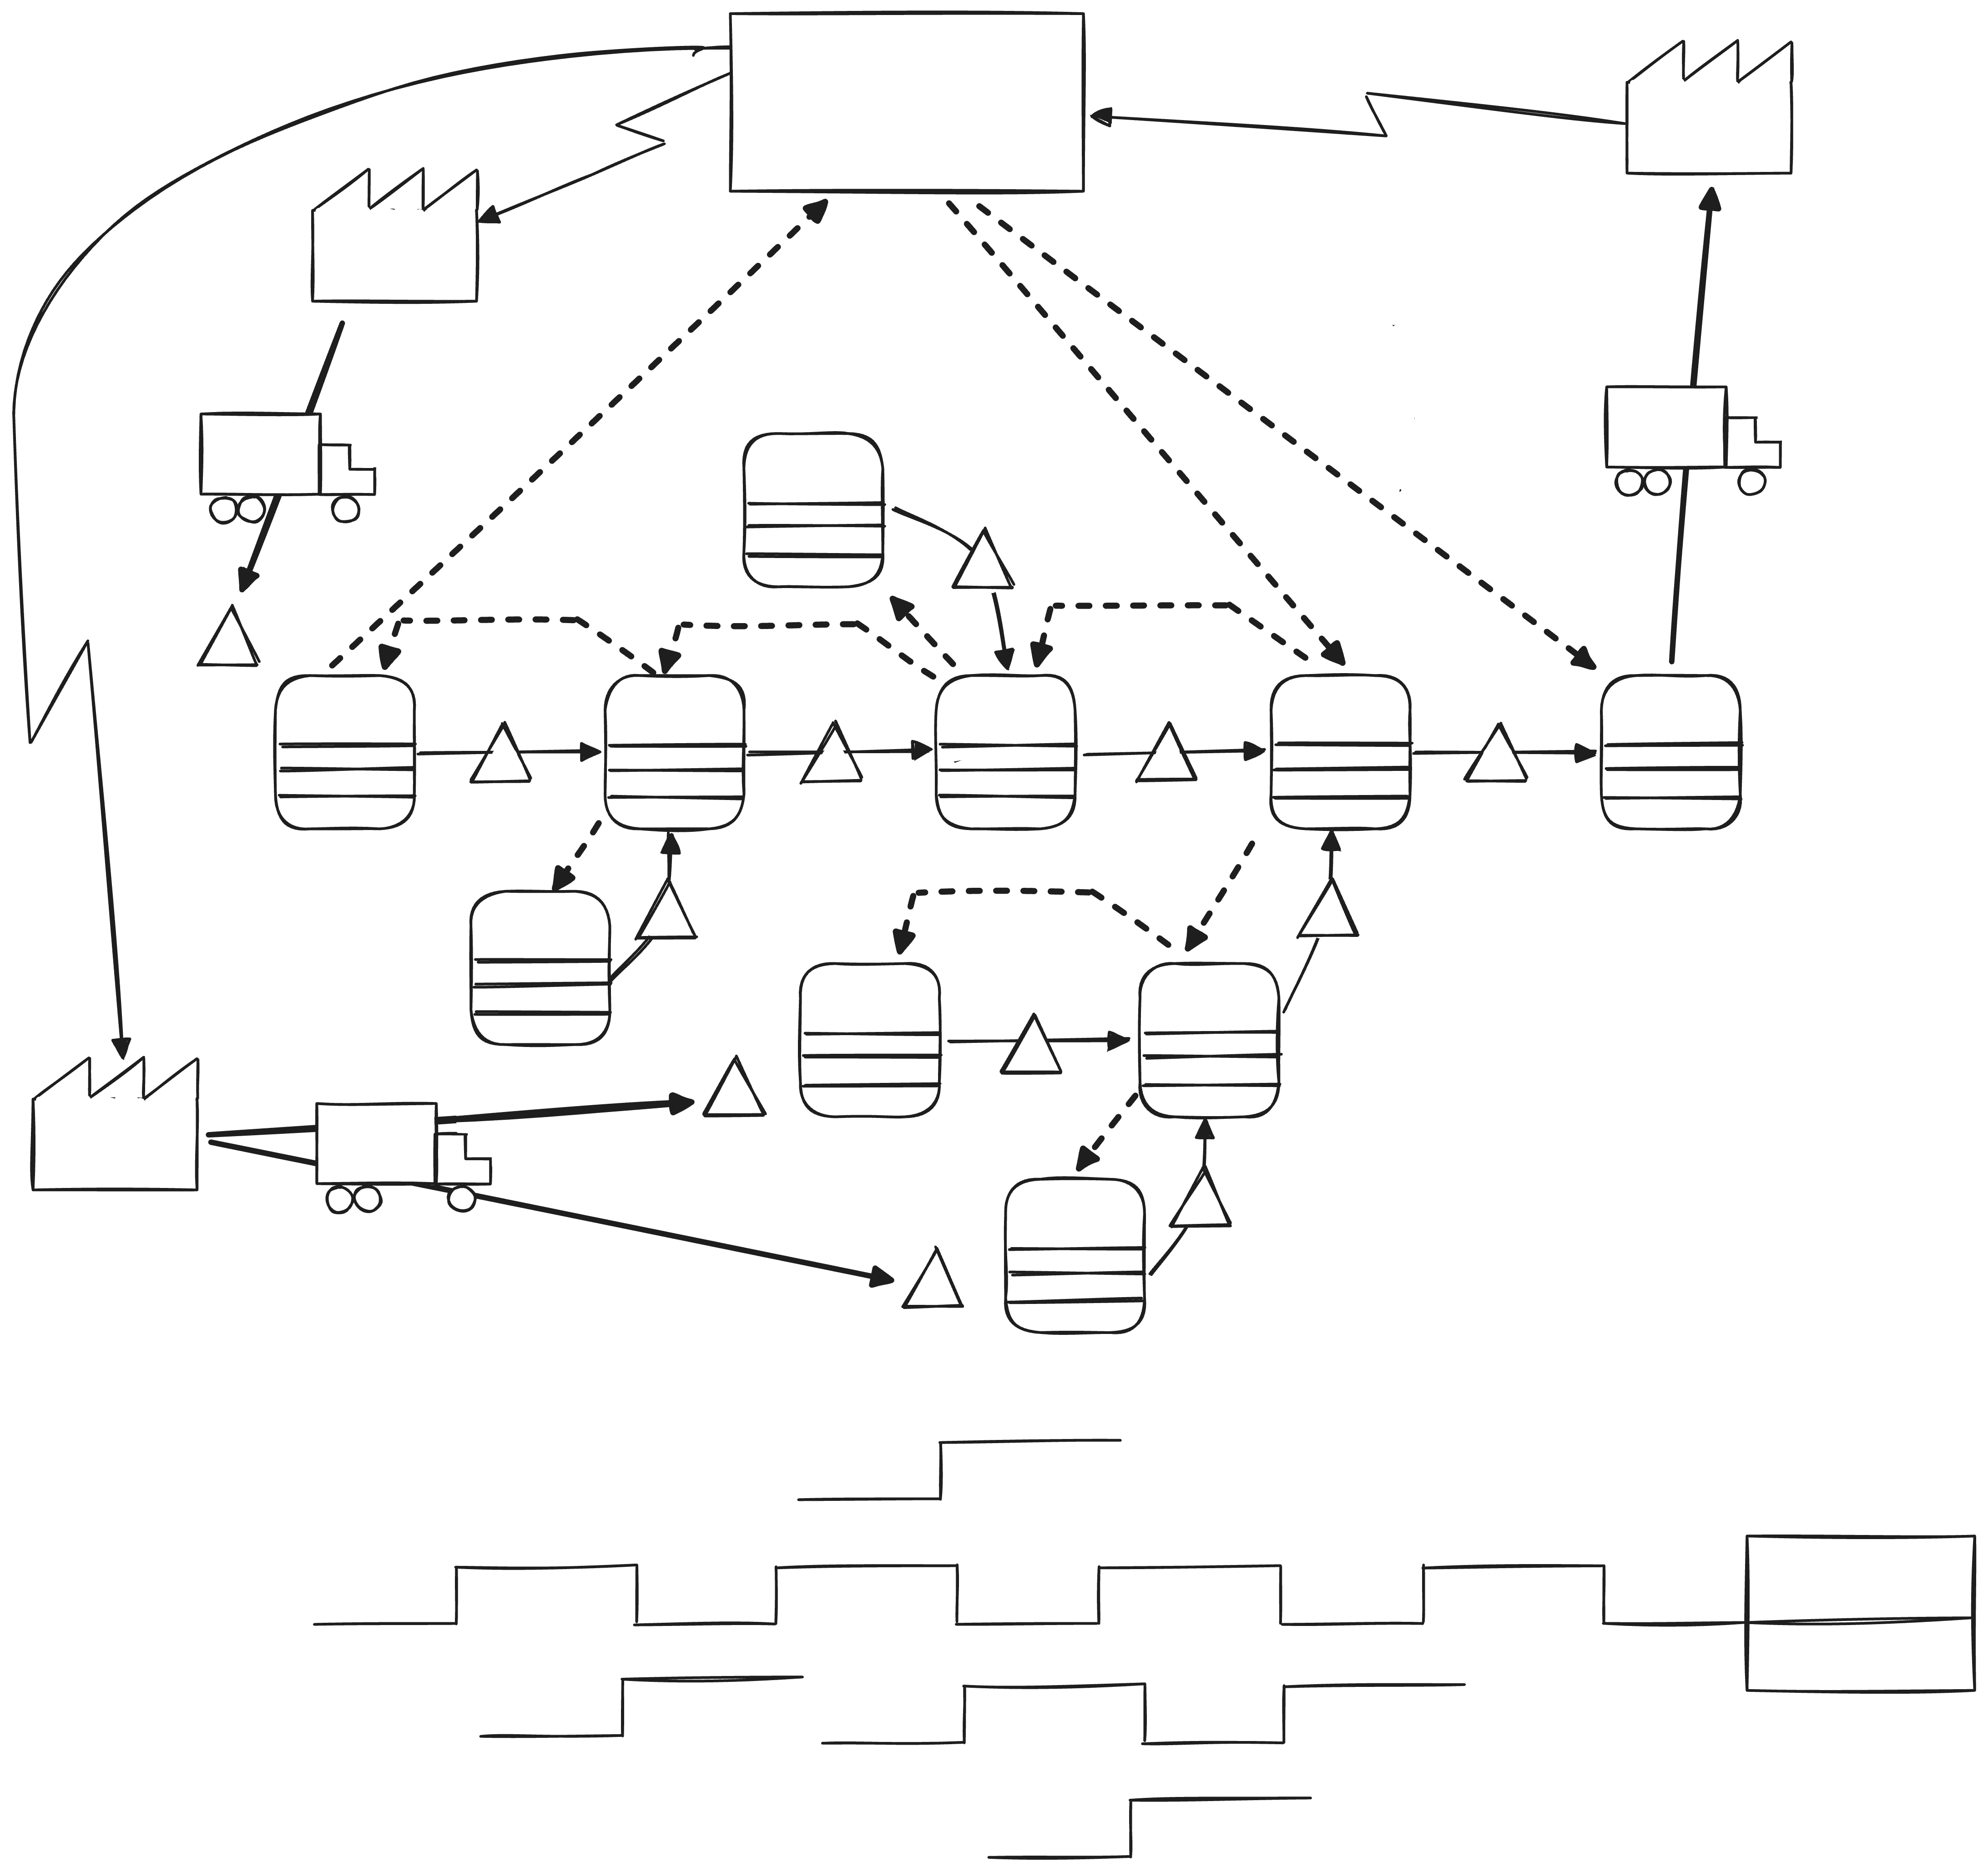
A comprehensive Value Stream Map includes three main elements:
#Material Flows
The core of the map, this element shows the manufacturing processes and cells required to transform inputs into outputs. Each node in the material flows contains data such as:
- Process cycle time
- Changeover time
- Lot size
- Yield
- Process uptime
These elements are used to calculate the Overall Equipment Effectiveness (OEE) and product lead-time.
Each connection in the material flows shows inventory levels and the inventory management approach (buffer, FIFO, kanban, etc.).
#Information Flows
The top section of the map illustrates how information moves through your system, including elements such as:
- Customer order frequency
- Scheduling methods
- Communication between processes
- Supplier information flow
- Where each node in the value stream gets it’s information to run.
Understanding information flows helps identify delays and inefficiencies in your planning and execution processes.
#Lead Time Ladder
When hand-drawn, this is usually at the bottom of the map. This section of the map quantifies the time elements in your value stream, including:
- Processing time (value-adding activities)
- Waiting time (inventory buffers)
- Total lead time (from order to delivery)
It’s common for throughput time to be significantly longer than processing time due to buffers, and a key objective of the exercise is to reduce this time in order to increase inventory turns and make the value stream more responsive to customer demand.
#Benefits of Value Stream Mapping
Creating and using Value Stream Maps provides numerous advantages:
- System Visibility: See your entire operation at a glance
- Waste Identification: Spot non-value-adding activities and inefficiencies
- Bottleneck Discovery: Identify constraints in your system
- Improvement Planning: Develop targeted strategies for enhancement
- Team Alignment: Create a shared understanding of your operation
- Performance Measurement: Establish baseline metrics for improvement
#Common Pitfalls to Avoid
When creating Value Stream Maps, be aware of these common mistakes:
- Incomplete Data: Ensure you have accurate information for all processes
- Focusing Only on Material Flow: Don’t neglect information flows
- One-Time Exercise: Update your map regularly as your system evolves
- Lack of Action: Use your map to drive specific improvement initiatives
#How Threaded Helps You Create and Use Value Stream Maps
Threaded provides a comprehensive platform for creating, managing, and leveraging Value Stream Maps:
- Digital Mapping: Create and edit value stream maps in a collaborative digital environment
- Data Integration: Connect your map to real-time operational data
- Automated Calculations: Calculate key metrics like OEE and lead time automatically
- Insight Generation: Identify improvement opportunities based on your map data
- Action Tracking: Create and manage improvement initiatives directly from your map
- Version Control: Track changes to your value stream over time
By centralizing your Value Stream Maps in Threaded, you ensure that everyone in your organization has access to the same information and can contribute to continuous improvement efforts.
Learn how to create a value stream map in Threaded in our Creating a Value Stream Map guide.