The Threaded Map
The Threaded Map turns a traditional value-stream map into an interactive, data-rich digital view of your entire manufacturing flow. Its nested layout lets you leap from a strategic overview to workstation-level details with one click.
Paired with a built-in AI assistant, the Threaded Map surfaces bottlenecks, shows the real-time impact of changes, and drives continuous improvement.
This guide walks through the core concepts, key features, and the practical steps to optimize your operations with the Threaded Map.
#Table of Contents
- The Threaded Map Data Model
- Visualizing and Optimizing Your Process
- Transform Your Manufacturing Operations
#The Threaded Map Data Model
The Threaded Map is built on a foundation that mirrors the reality of a manufacturing floor while providing powerful digital capabilities with embedded AI.
#AI-Native

Threaded is an AI-native platform with artificial intelligence deeply integrated from the ground up. This means the Threaded AI assistant can navigate and process information about the map in-context, combining frontier AI models’ deep manufacturing knowledge with your specific operations. This AI-data fusion enables Threaded to provide actionable, contextual insights that drive real improvement in manufacturing.
Learn more about how AI works in threaded here
#Operations: The Building Blocks
The Threaded Map represents your manufacturing processes as interconnected building blocks called operations. Each operation transforms inputs into outputs, whether that’s stamping raw aluminum into car door panels, assembling electronic components into modules, or inspecting finished products for quality compliance.
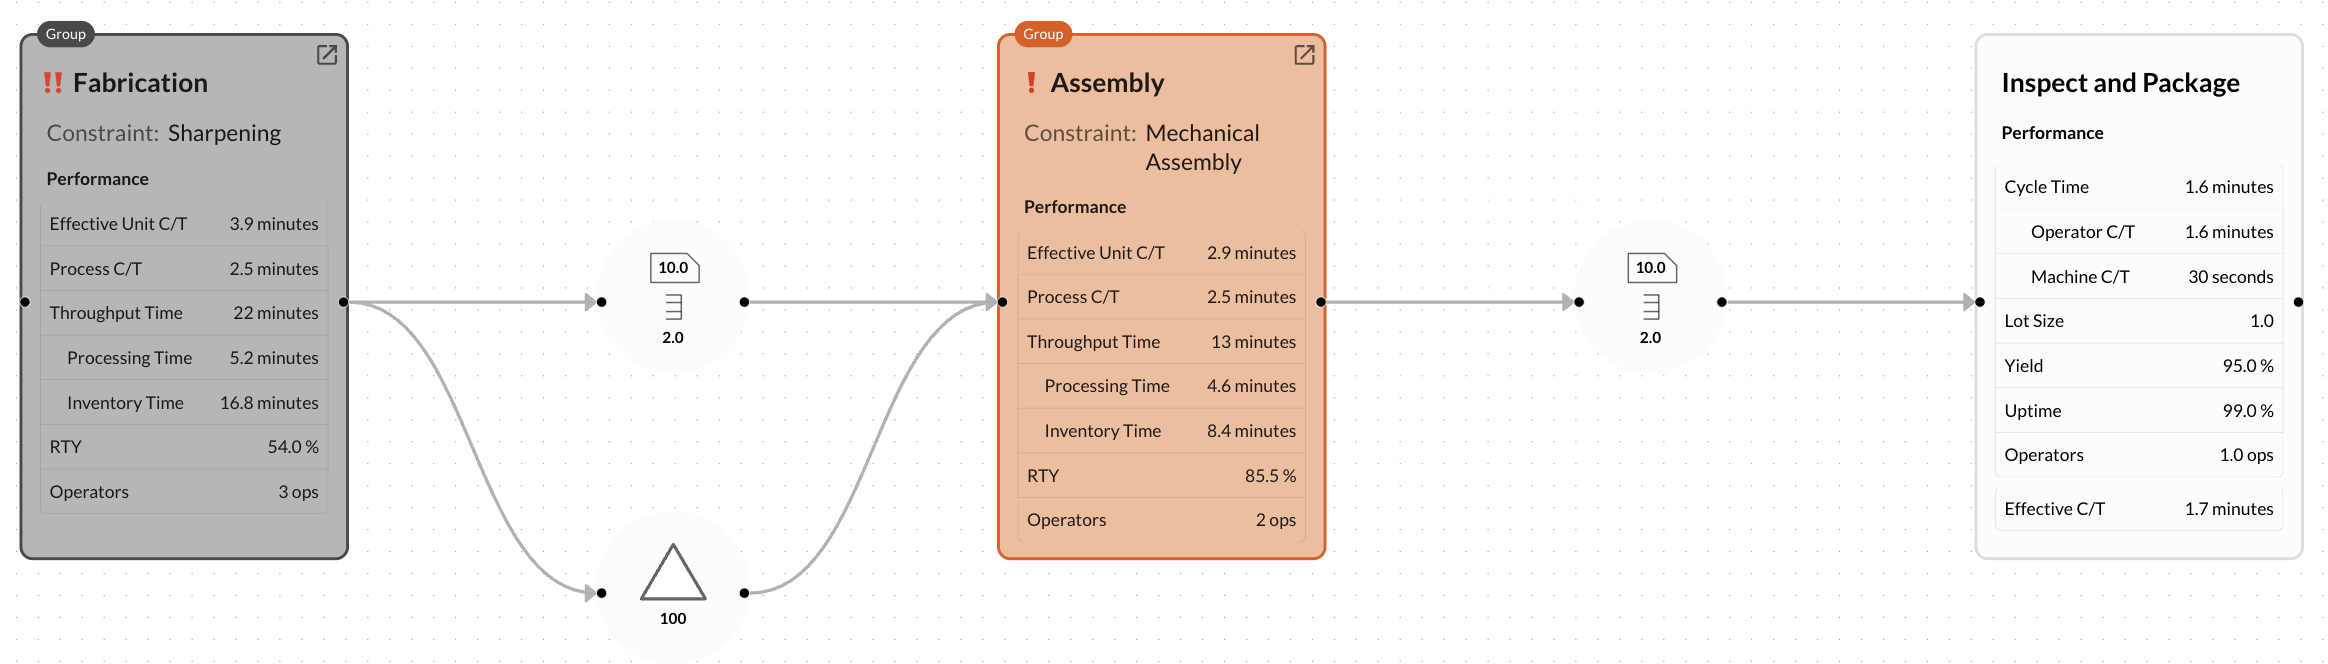
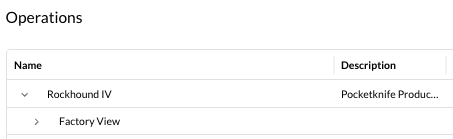
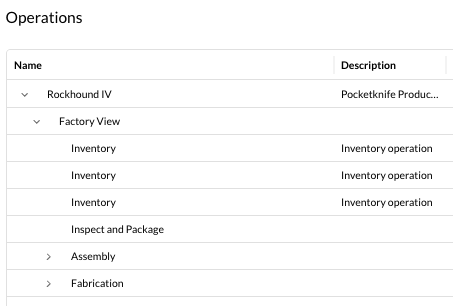
These operations exist in a nested structure that mirrors how manufacturing actually works. Let’s use the Rockhound IV Pocketknife Factory as an example. Your high-level “Factory” breaks down into “Fabrication” and “Assembly” operations, and and each of those break down further into specific sub-operations.
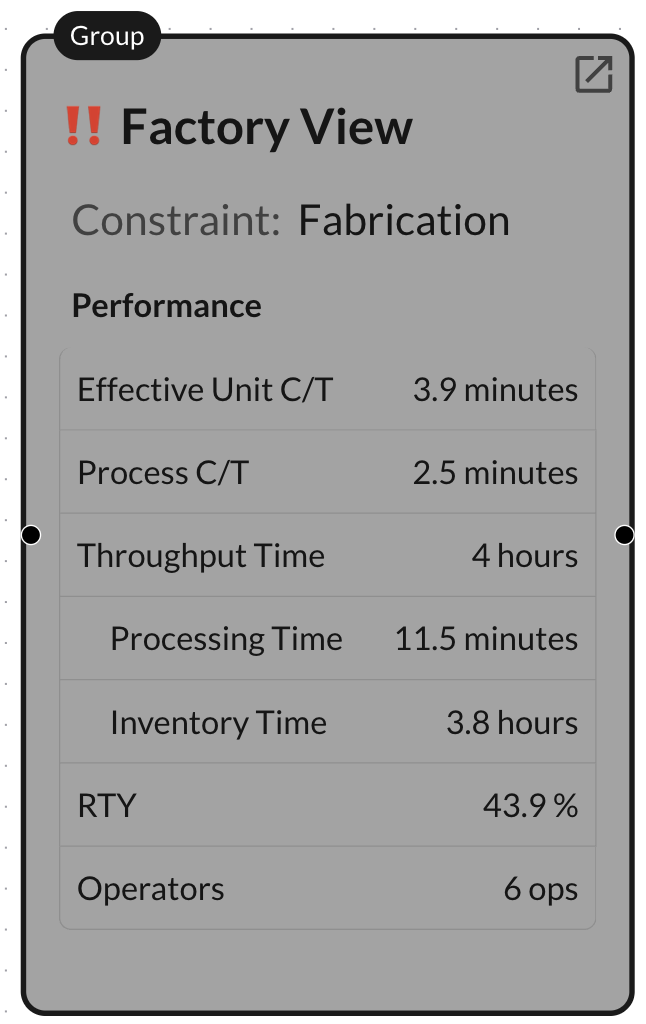
The Threaded map that lets you zoom from a high level performance overview of the entire “Factory View” operation, to a detailed view of the “Blade Forge” operation.
#Operation Types
-
Build Operations capture your core manufacturing processes - things like stamping, welding, assembly, and packaging. These operations transform raw materials and components into finished products, tracking cycle times, operator requirements, and quality metrics.
-
Inventory Operations dictate how material flows through the value stream, and can be defined as direct assemblies, buffers, FIFO lanes, and Kanban inventory systems between build operations
-
Individual Operations represent individual work steps and contain core performance metadata like cycle time, operator count, uptime and yield. (e.g. the “Sharpening” operation requires 1 operator and has a cycle time of 2.5 min)
-
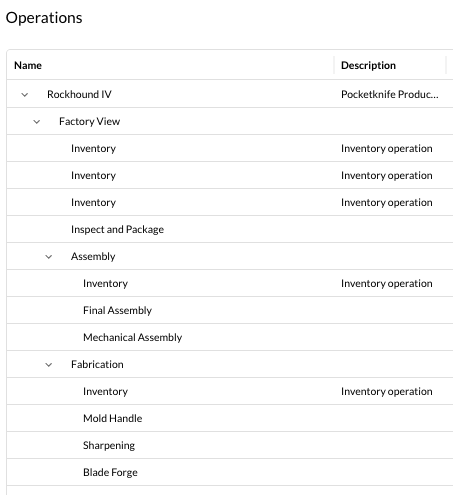
Group Operations act like containers that roll up data from their child operations. Groups allow you to view the overall performance of a group of individual operations, or smaller groups (e.g. the “Assembly” group contains the Mechanical Assembly and Final Assembly operations)
#Intelligent Relationships that Represent Reality
Operations don’t exist in isolation - they’re connected through relationships that model real manufacturing flows in the same way that operators understand their factories. For example:
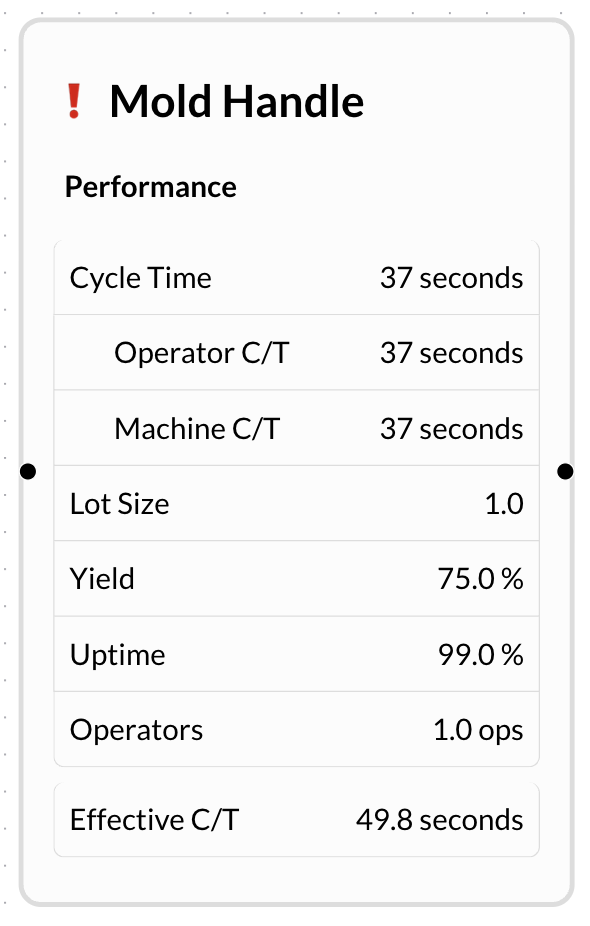
- Parent/Child Relationships: “Fabrication” contains “Molde Handle,” “Blade Forge,” and “Sharpening”
- Sequential Flows: Parts flow from “Blade Forge” → “Sharpening” → “Mechanical Assembly” → “Final Assembly”
- Input/Output Connections: “Mold Handle” and “Mechanical Assembly” provide inputs to “Final Assembly”
- Automatic Propagation: Change the cycle time in “Sharpening” and see the impact ripple through “Fabrication” all the way up to “Factory View”
#Operation Metadata: Performance Data that Drives Decisions
Each operation captures the parameters that drive performance calculations:
User Inputs:
- Cycle Time Information to understand and balance both human and machine resources
- Machine Cycle Time: The machine time required to complete an operation
- Operator Cycle Time: The human time required to complete an operation
- Lot Size: The number of units processed simultaneously
- Yield (%): First-pass yield with automatic rolled throughput yield calculations
- Uptime (%): Availability accounting for planned and unplanned downtime
- Operators: The number of people needed to complete the operation
Calculated Metrics:
- Cycle Time: The calculated max value between Machine and Operator Cycle Time
- Effective Cycle Time: The effective time to process a first quality production unit through the operation - accounting for station cycle time, uptime, yield, and lot size
#Visualizing and Optimizing Your Process
The Threaded Map provides a range of features designed to enhance visibility, analysis, and collaboration.
#Navigate from Strategy to Execution
The Threaded Map’s nested structure transforms how teams communicate about complex manufacturing processes. Unlike traditional flat process maps, you (and the AI assistant) can seamlessly navigate between big picture and detailed views.
Multi-Level Navigation
Visual Clarity at Every Level
Collapse to the Factory View level to review overall factory performance, expand to the Fabrication level for a daily standup with the Fabrication Line, or drill down to the Sharpening sub-processes if you are seeing quality or performance issues at the Sharpening.
No Matter which level you’re viewing, the map maintains visual clarity through:
- Smart Aggregation: Child metrics automatically roll up to parent operations
- Performance Indicators: The primary and secondary constraints are clearly indicated at every level
- Contextual Details: Information scales appropriately with your current view level
- Relationship Preservation: Connections between operations remain clear at every zoom level
#Dynamic Performance Analysis
The Threaded Map automatically calculates and displays performance metrics at every level, turning static diagrams into dynamic operational intelligence.
#Responsive Performance Rollups
Child operation metrics automatically roll up to group operations, giving you accurate performance data whether you’re viewing individual stations or entire production lines.
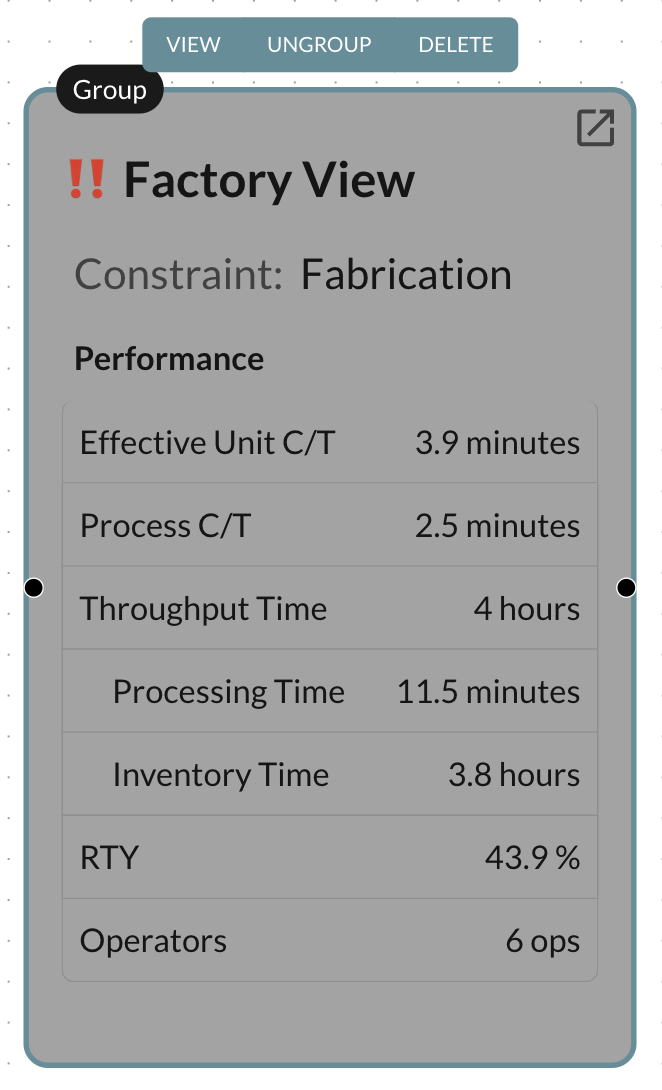
- Effective Cycle Time: The actual expected time to process each quality production unit, accounting for uptime, yield, and lot size effects of all operations in a group.
- Cycle Time: The sum of the station cycle times of operations within the group.
- Processing Time: The total time spent processing or building in a production sequence
- Inventory Time: The amount of time material is waiting to be processed. Calculated based on inventory type and flow parameters
- Throughput Time: The total time to complete a production sequence, including Processing Time and Inventory Time
- RTY (Rolled Throughput Yield): Cumulative yield across operations within the group
- Operators: Total operators required across operations within the group
#Automatic Constraint Identification
Primary and secondary constraints are clearly identified at every level:
- System Level: “Fabrication” identified as primary constraint with 3.9-min effective cycle time
- Line Level: “Sharpening” is the bottleneck within fabrication
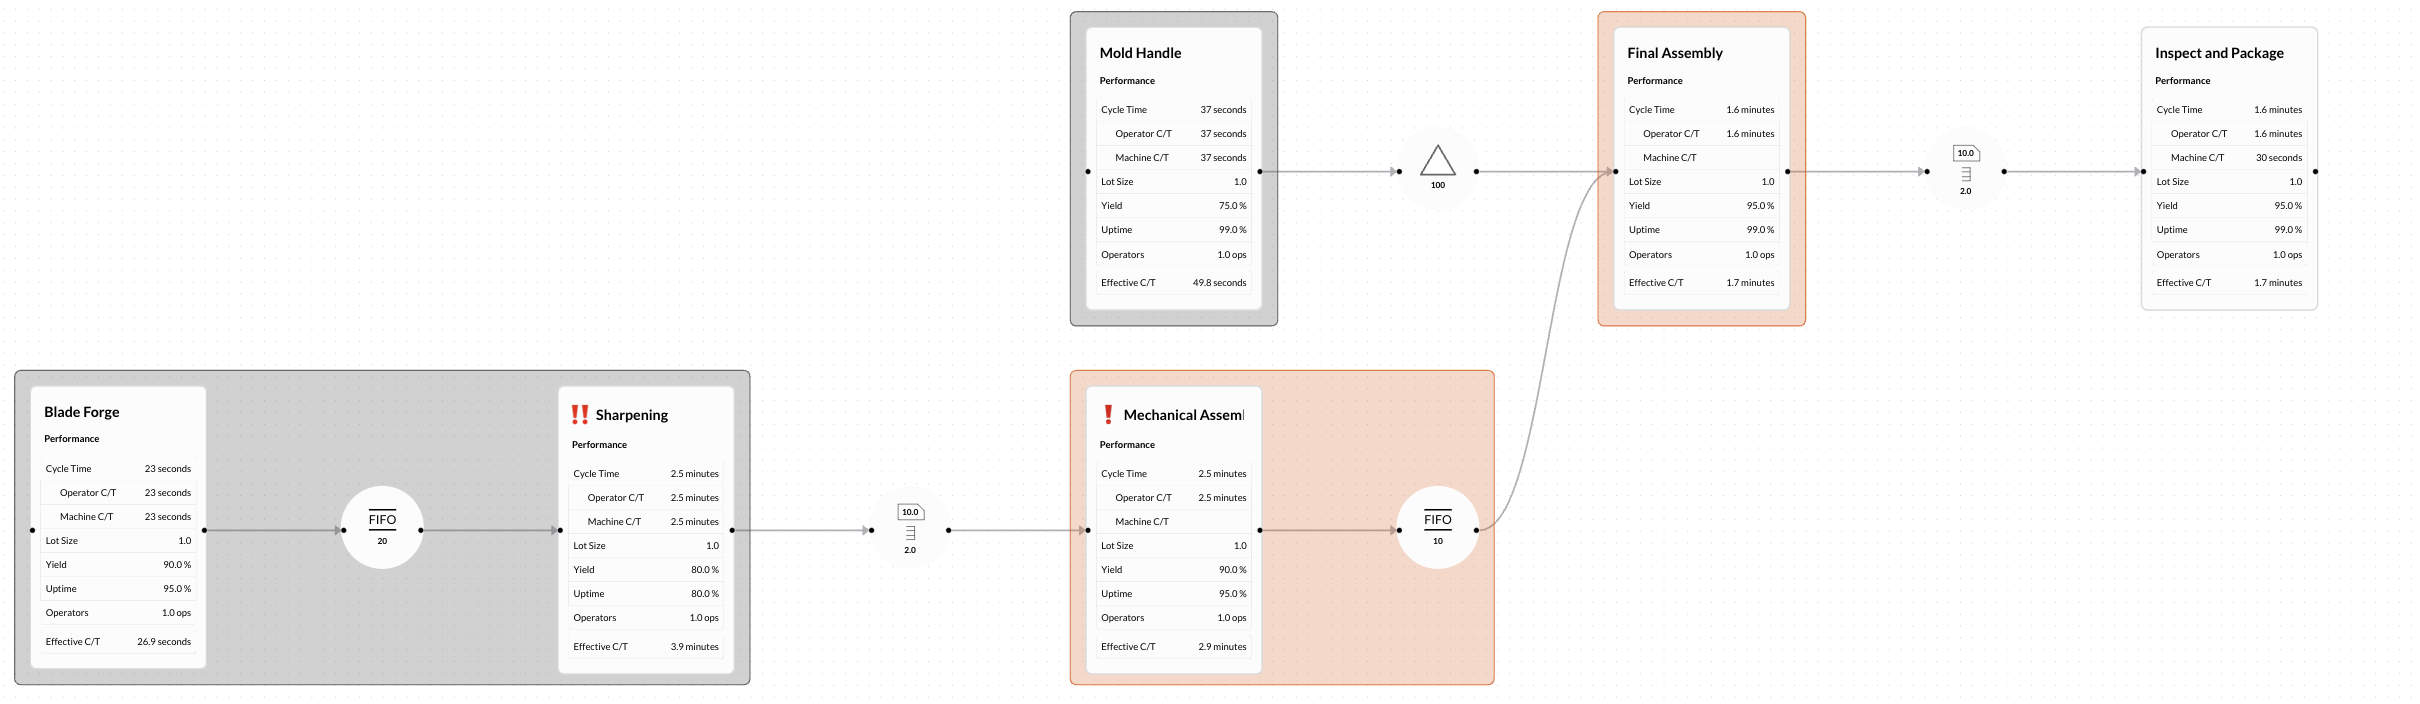
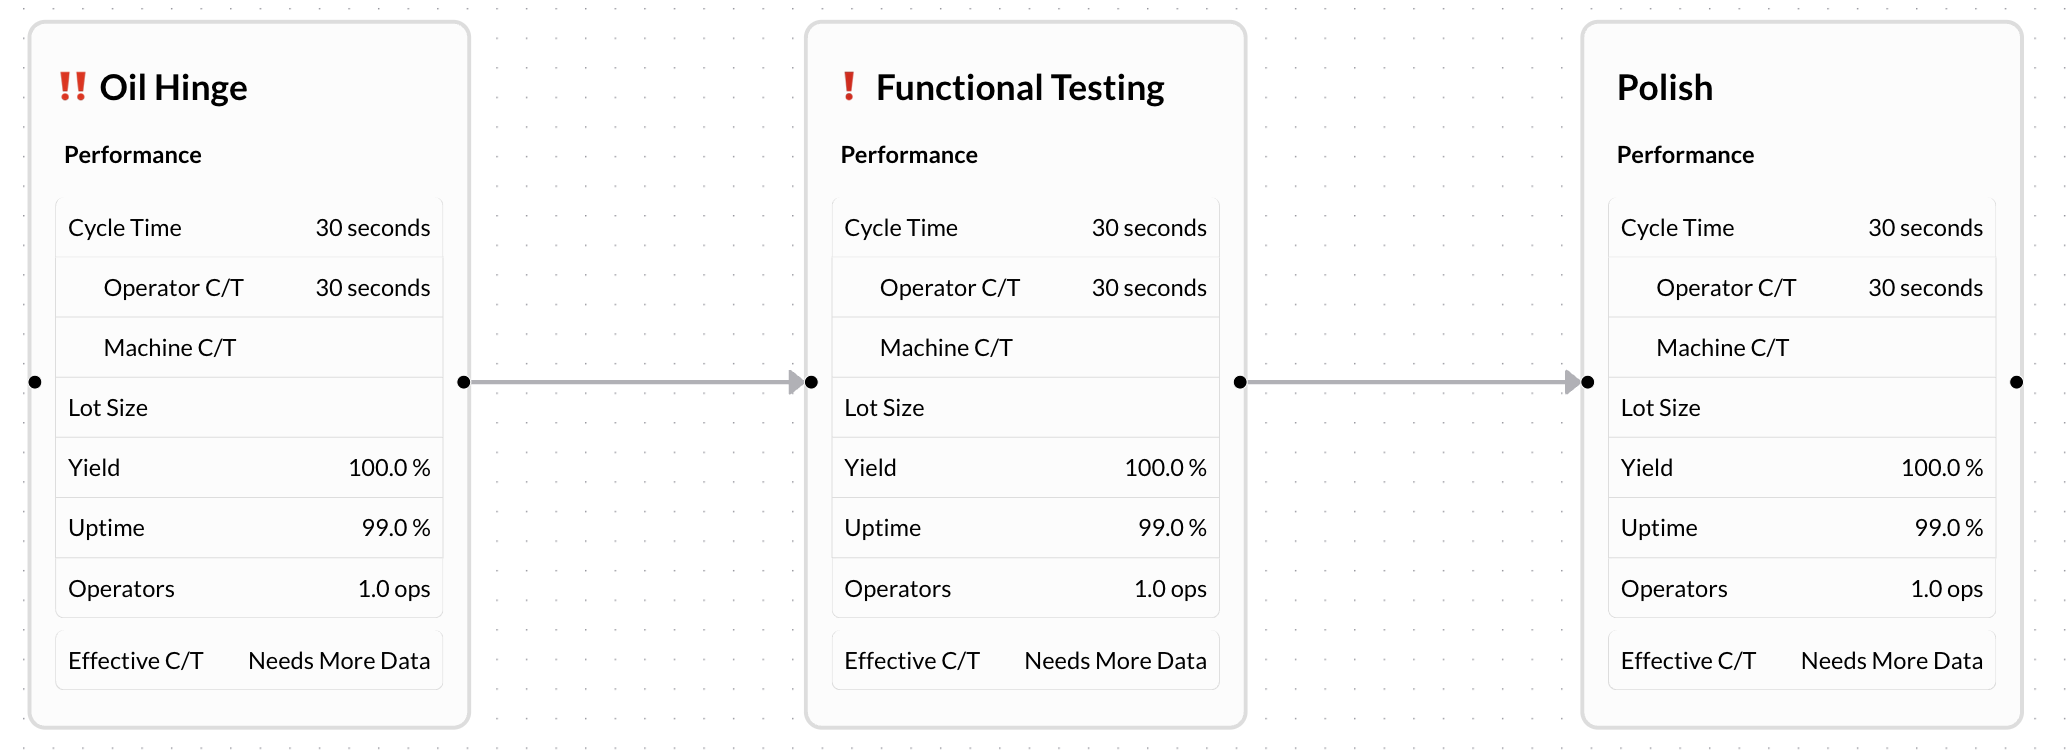
- Visual Indicators: Primary (‼️) and secondary (❗) constraints indicated at every level
#Integrated Line Balancing and Capacity Planning
Instant operational insights through integrated analysis tools, at every level:
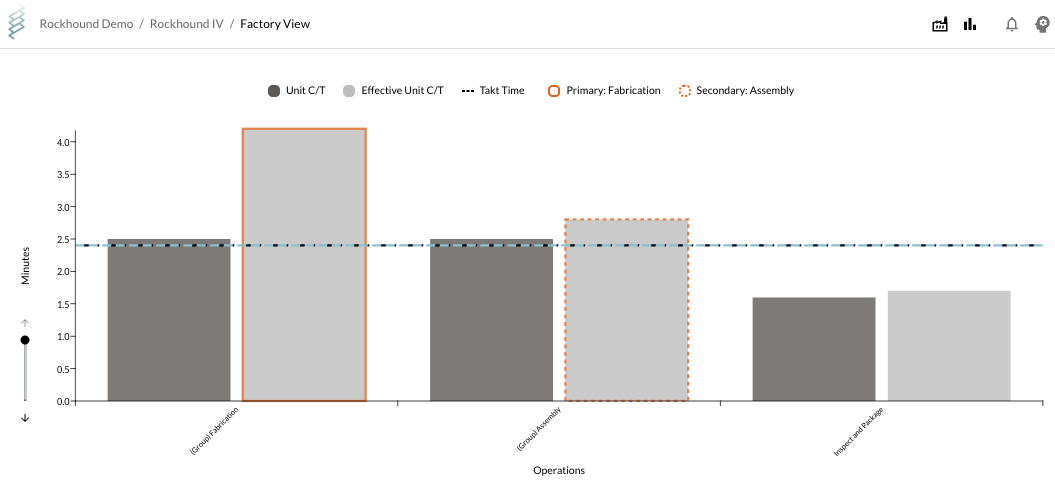
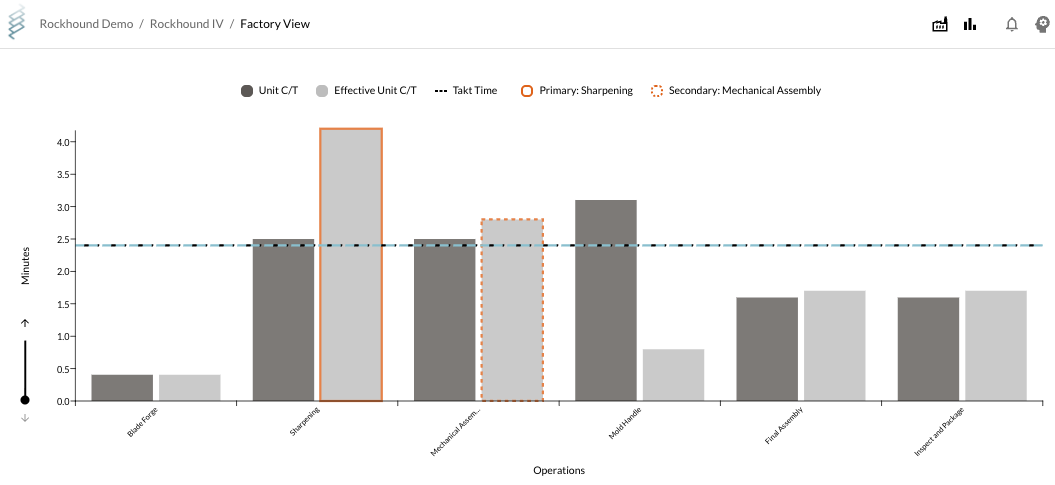
- Cycle Time Distribution: A responsive histogram shows effective cycle time across operations
- Takt Time Comparison: The takt time calculated from factory operating parameters is displayed on the chart for comparison to actual performance
#Real-Time Impact Analysis
Performance metrics update automatically as you make changes:
- Reduce “Sharpening” cycle time by 30 seconds → see impact propagate through entire “Factory View” assembly
- Increase “Blade Forge” uptime from 87% to 92% → watch overall throughput calculations refresh
- Improve bottleneck performance → observe constraint shifts and new bottleneck identification
Note: Starter and Builder plan users can manually update maps to reflect performance changes, while Scale plan users can connect live factory data sources for real-time performance tracking.
#Building and Editing Your Map
Transform process redesign into an intuitive, visual experience:
#Grouping and Ungrouping Operations
Combine related operations into logical groupings for simplified visualization and analysis. Select multiple operations, create a group, and reduce visual complexity for high-level discussions while preserving detailed analysis capability. Grouped operations automatically aggregate cycle times, operator counts, and constraints.
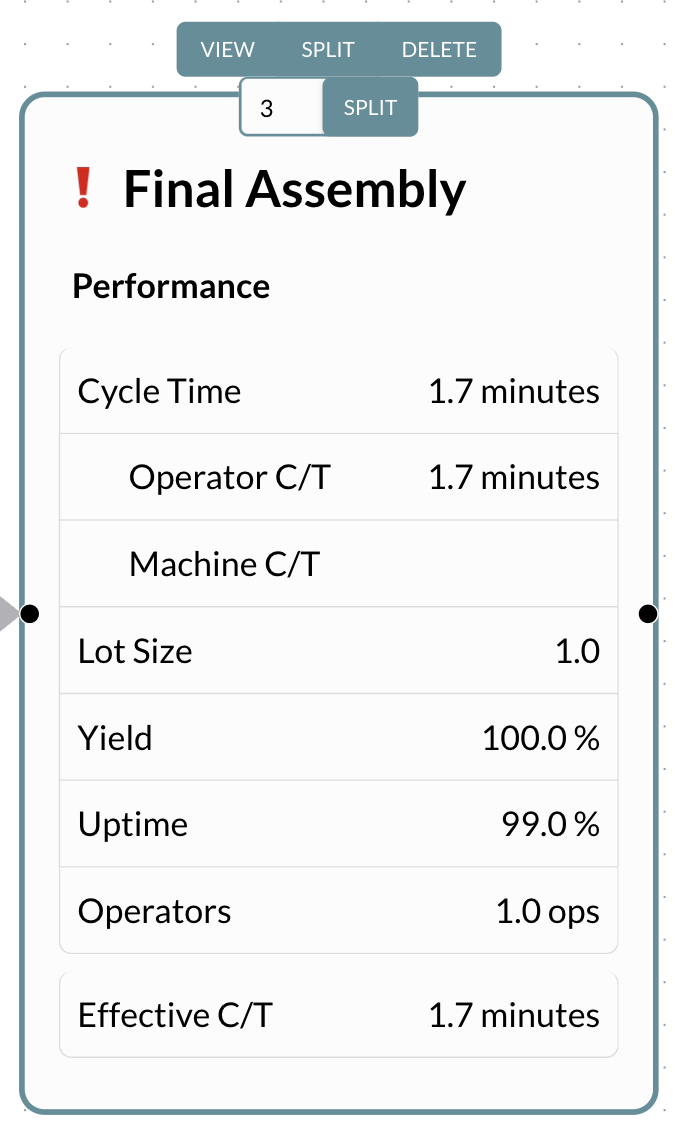
#Splitting Operations
Break complex operations into sequential steps with automatic relationship management.
- Split the 1.7 min “Final Assembly” operation into smaller stations for better line balancing.
#Adding Child Operations
Expand operations by adding detailed sub-processes without disrupting existing relationships.
- Add “Quality Check” and “Assemble Box” sub-operations to the existing “Inspect and Package” operation.
#Real-Time Collaboration
Teams work together digitally and in real-time on shared value streams, documents, and action items. Communication happens through in-app conversations and user @mentions that instantly notify team members via in-app alerts and email, ensuring critical discussions never get missed.
#Transform Your Manufacturing Operations
The Threaded Map represents more than just another software tool—it’s a fundamental transformation in how manufacturing organizations collaborate, visualize, and optimize their operations. By replacing static documentation with dynamic, intelligent mapping, you’re not just improving your current processes; you’re building the foundation for continuous operational excellence.
The future of manufacturing operations management is collaborative, visual, and intelligent. Ready to lead that future?
Take the Next Step
Sign up → Try the Threaded Map with your actual processes today