OEE? Yeah you know me!
#Understanding Overall Equipment Effectiveness (OEE)
OEE is like 90’s Rap for Manufacturing Productivity - it’s the gold standard.
OEE provides a comprehensive framework for understanding where losses occur in your operation, helping you identify exactly what needs to be fixed to improve performance.
Think of OEE as a health check for your manufacturing system. Just as a doctor monitors vital signs to assess your health, OEE monitors the vital signs of your manufacturing operation to assess its performance.
#The Reality of Manufacturing Efficiency
Let’s start with a simple example. Suppose it takes you 1 hour to build a product from start to finish. If you work 8 hours a day, 5 days a week, 50 weeks a year, you should be able to make 2,000 units a year (8 × 5 × 50), right?
Unfortunately, no.
That calculation assumes 100% efficiency—meaning you’ll only build good parts, within planned cycle time, without any interruptions or equipment downtime. But in reality, you’ll experience:
- Slower performance on some days
- Random defects
- Equipment failures and downtime
- Material shortages
- Quality issues
You could try to make up these losses with overtime, but that will be unsustainable and drive up costs, killing profitability.
#The Three Components of OEE
OEE breaks down efficiency into three practical categories:
OEE = Yield × Uptime × Cycle Time Performance
#1. Yield (Quality)
Definition: Good parts produced / Total parts produced
Example: If you produce 8 units in a day but 1 is defective, your yield is 87.5% (7/8).
Impact: Each defect essentially costs you 3 units:
- The defect itself
- The unit you build to replace the defect
- The opportunity cost of the good unit you could have been making while fixing the defect
Keeping yield high is critical for profitability and is arguably the most important component of OEE.
#2. Uptime (Availability)
Definition: (Planned operating time - Downtime) / Planned operating time
Example: In an 8-hour shift with a 30-minute lunch and two 15-minute breaks, your planned operating time is 7 hours. If you experience 1 hour of downtime, your uptime is 85.7% (6/7).
Important Note: Your planned operating time is not necessarily the same as the length of your shift. Breaks for rest, lunch, or planned downtime should not be included in the calculation.
#3. Cycle Time Performance (Speed)
Definition: (Planned Cycle time × Total Parts Produced) / (Planned Operating Time - Downtime)
Example: If your planned cycle time is 10 minutes per unit, you have 7 hours of planned operating time, 1 hour of downtime, and you produce 36 units, your cycle time performance is 85.7% ((10 × 36) / (420 - 60)).
Important Note: This should never exceed 100%. If it does, you should reset your planned cycle time, otherwise a >100% performance component will hide other issues and drive other wastes into the system.
#Calculating Your OEE
With these 3 numbers, we can calculate OEE, and it’s almost always much lower than you think. For example:
- 90% yield
- 90% uptime
- 90% cycle time performance
These look pretty good (a 90 is an “A”, right?), but your calculated OEE is the product of the three, or only 73%.
Operating with the OEE in the example above means you’re only going to get ~6 units/day, and 1,460/year. If you’ve made commitments to hit 2000, and can’t figure out how to increase each component and/or speed up and re-set your planned cycle time, you’ll end up having to run almost 2 full shifts of overtime each week, killing your profitability.
#World-Class OEE
“World Class” OEE is often considered to be about 85% (roughly 95% for each component), and it’s not uncommon for it to be significantly lower. However, understanding what it is and where it comes from is critical in understanding how to put together a successful plan.
Continuously monitoring OEE will allow you to know where you need to put your efforts (improving yield? Reducing downtime? Improving performance or figuring out how to speed up the process) in order to ramp effectively and continuously improve your profitability.
#How Threaded Helps You Track and Improve OEE
Threaded provides powerful tools for tracking, analyzing, and improving OEE:
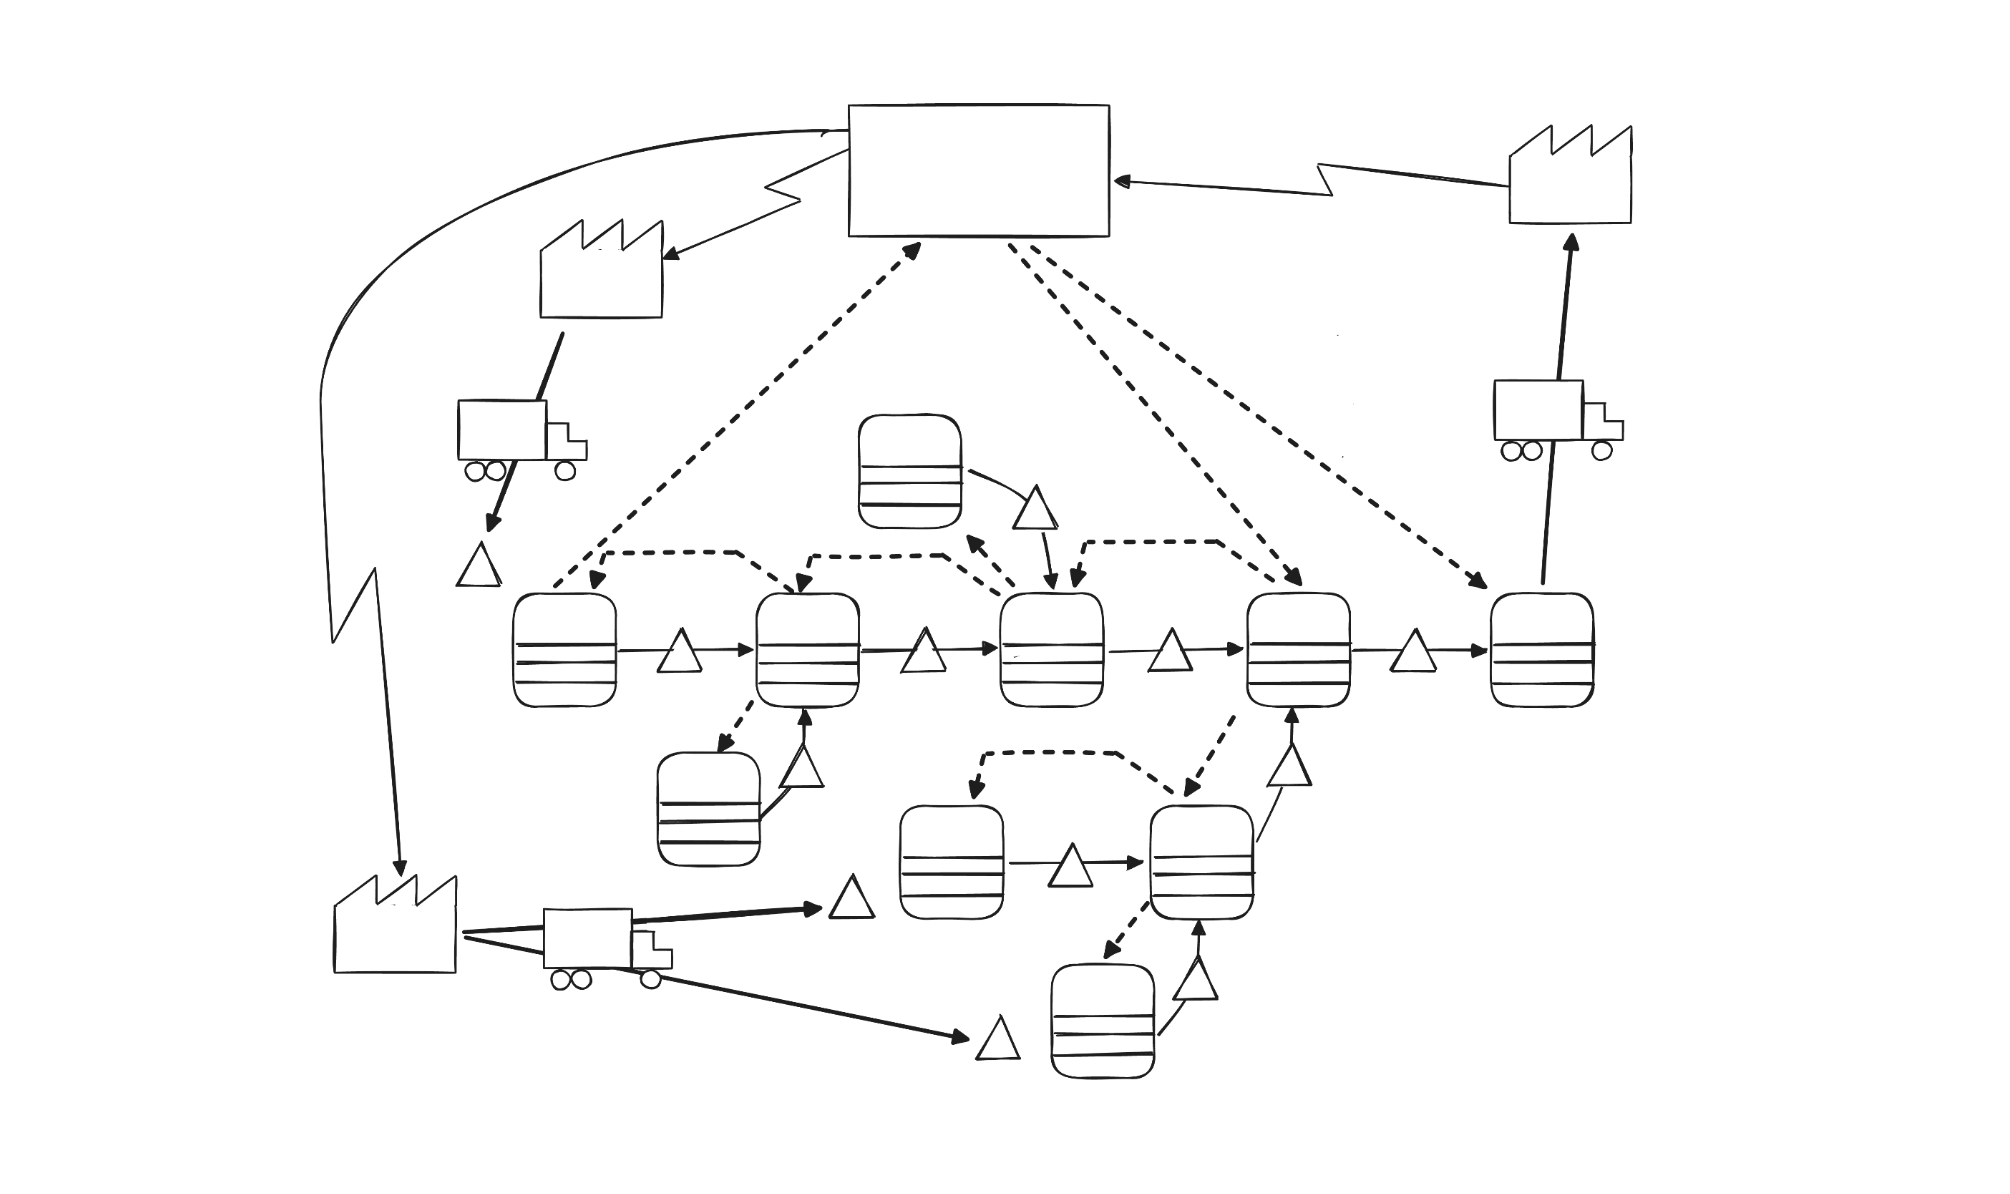
- Automatic OEE Calculation: Threaded calculates OEE automatically based on your value stream data. You’ll find the OEE at the top of each node in your value stream.
- Component Analysis: Drill down into yield, uptime, and cycle time performance to identify improvement opportunities
- Action Tracking: Create and manage improvement initiatives directly from your OEE data
By centralizing your OEE data in Threaded, you ensure that everyone in your organization has access to the same information and can contribute to continuous improvement efforts.
Learn more about value stream mapping and OEE tracking in our What is a Value Stream Map? guide.